
Hey everyone! I am Ishaan Shah (ishaanshah), a sophomore at International Institute of Information Technology – Hyderabad, India. This summer, I worked on ListenBrainz as a participant in Google Summer of Code ’20. My project involved generating statistics and visualisations for users using Apache Spark. This blog is an overview about the work I did and my experience working with ListenBrainz.
I started contributing to ListenBrainz in January 2020. My first PR was for LB-179, a small Quality of Life improvement to the LastFM importer. My first major contribution was porting the LastFM importer to ReactJS. Over the next two months, I continued working on the frontend, where I mainly worked on improving the frontend infrastructure by adding support for automated testing, porting the codebase to TypeScript and standardising the frontend code using ESLint and Prettier.
After making a few patches, I understood how ListenBrainz worked and got comfortable with the codebase. I decided to make a proposal for adding statistics to ListenBrainz using Apache Spark. While writing the proposal, I referred to many other websites, blogs, as well as community discussions for different ideas about statistics which could be added. After some research, I narrowed down on the specific graphs and statistics that I wanted to calculate during GSoC.
Community Bonding Period
Since I had been working with the MetaBrainz community since January, I was familiar with how things worked in the community. So we decided to use the Community Bonding Period for fixing and updating the Top Artists charts for a user. The first task that I took up was to add an API endpoint for fetching the Top Artists data for a user programmatically. Until then, I had mostly spent my time working on the frontend, this task helped me in getting familiar with the backend architecture. Next, I worked on porting the Top Artist graph from d3 to nivo – a charting library built with ReactJS and d3. The Top Artists graph only supported All Time statistics before. I worked on adding support for more time ranges. This was the first time I worked with Apache Spark and the PR for this took quite some time, but it was essential that we got it right as most of the statistics we built further would use a similar workflow. After we were satisfied with the overall flow of the data from our Spark cluster to the web server, I started working on showing the stats for different time ranges on the website. Although this task seemed easy at first, it took much longer than expected. We encountered some bugs and received some user feedback when we deployed the graph to production. The rest of this period was spent on incorporating the user feedback and fixing the bugs.

First Coding Period
We now had a somewhat stable pipeline for calculating the stats and sending them to the server. I started working on the backend for Top Releases stats for a user. We ran into memory issues when calculating these stats on the cluster, so I spent some time finding the cause of the issue and realised that we were collecting the results all at once which was causing the driver to run out of memory. I fixed this by collecting the results for each user separately and tweaking some RabbitMQ parameters to make sure that messages aren’t dropped while sending them to the server (PR #897). After this, I added Top Recordings for a user. Now we had a brand new Charts page that displayed the user’s Top Artists/Releases/Recordings for different time ranges. Next I started working on temporal statistics for a user i.e, number of listens in a past time range. The query that I wrote for calculating this data turned out to be pretty inefficient for larger datasets. So I ended up writing two versions of the same query: one for large datasets and one for smaller ones. While working on displaying these stats on the frontend, I tried various representations of the data. I finally settled on displaying the data as bar graphs, as shown on this report view.

Second Coding Period
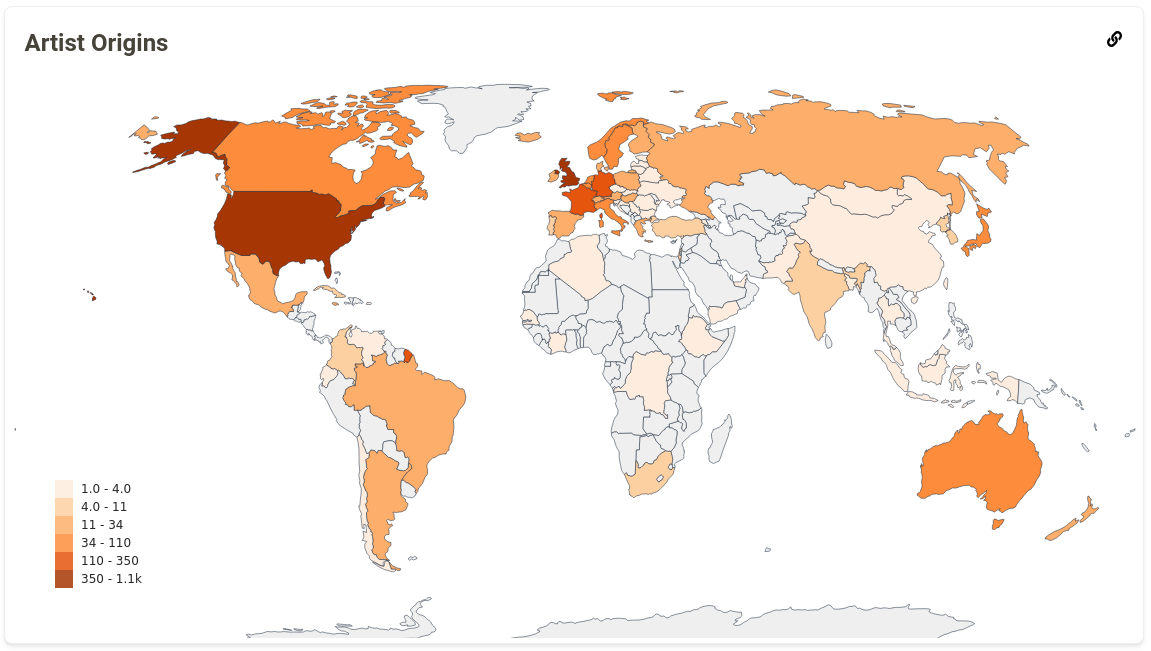
I added two more graphs in this period: Daily Activity and Artist Origins. The Daily Activity graph shows the number of listens a user has at a particular time of the day. I implemented the query for calculating this data in a slightly different way compared to the Listening Activity query. This change improved the query speed significantly. I had some trouble finding a correct way to represent this data. My mentor helped me in this by suggesting the usage of a Heatmap, and the results turned out to be pretty good.

Next, we worked on the Artist Origins graph, which provides an insight into the geographical diversity of a user’s musical taste. I had a lot of help from the ListenBrainz team for this graph and I couldn’t have done this graph without their help. This was by far the most interesting stat that I worked on during the project. Furthermore it laid a general framework to calculate statistics using the data from MusicBrainz. After deploying this map on production, we received feedback from the users that the map looked plain for most of them and there wasn’t much colour difference between different regions. This happened because people generally tend to listen more songs from their home country, so there is a huge difference between the country with maximum artists and average number artists from other countries. We fixed this issue by changing the colour scale from linear to logarithmic.

Final Coding Period
We now turned our attention towards calculating some stats for the whole website. We decided to make a graph for the Top Artists over different time ranges. We thought that this would be relatively easy given that we had already done something similar for individual users before. However we hit an unexpected bump; the data we were calculating was not accurate, mainly because of various different sources of the artists and some minor changes in the artists’ name or metadata resulted in a different entry with a different listen count for the same artist. Moreover, we found a couple of users spamming our website for self promotion and we did not have a solid way to deal with this. Around this time, my college resumed and the amount of time I could dedicate to LB reduced severely. So we decided to use the remaining time to work on improving the frequency at which stats are updated. I have an open PR (#1052) for doing this at the time of me writing this blog and we should be able to implement this functionality in the near future.
Experience
The past 4 months have taught me a lot of things. I learnt new technical concepts everyday. I started writing code as a developer rather than a programmer. I understood the importance of proper unit and integration testing (even though it was my least favourite part while adding a new functionality). I also found it much easier to talk and interact with people both online and in real life. Frequent deployments of new features to production helped us a lot. We were able to catch bugs when we still had some context over the code written and also received feedback from the users about how we could improve the new features added. It also kept me motivated to keep working on new graphs and statistics and gave me a sense of satisfaction when I saw them on the production server. I also learnt that things don’t always go the way we expect them to. More often than not, you will run into some bumps while adding new features so it is better to keep some extra time to deal with these issues.
GSoC gave me a wonderful opportunity to work with some amazing people from all over the globe. I was not able to complete all the graphs that I had planned for this summer, but I do plan to continue working on ListenBrainz to add more statistics and new features.
Special Thanks
- Param Singh (iliekcomputers) for being an amazing mentor and helping me whenever I was stuck on an issue.
- Robert Kaye (ruaok) for providing some really insightful feedback and the MusicBrainz data that was required for calculating the Artist Origin map.
- Nicolas Pelletier (Mr_Monkey) for helping me with the frontend for the user Charts page and providing some amazing tips for ReactJS.
No comments:
Post a Comment